Branch target prediction and performance
I was recently analyzing the performance of DIRACBenchmark after having seen a peculiar speed-up in the transition from Sandy Bridge/Ivy Bridge architecture to Haswell/Broadwell. This benchmark basically generates a long sequence of random numbers via Python random module and performs some multiply and accumulate operations. What stood out after some initial tests was a 50% improvement in runtime when switching from Xeon v2 to Xeon v3 processors. All the other benchmarks I was familiar with were showing a difference that was in the range 10%-20%, but this Python script was definitely an outlier.
Systems under test
I was comparing the performance on the following two systems:
| Ivy Bridge | Haswell | |
| CPU | Dual socket E5-2650v2 @ 2.60 GHz | Dual socket E5-2640v3 @ 2.60 GHz |
| 8 physical cores, 16 threads, 2.8GHz Turbo | 8 physical cores, 10 threads, 3.4 GHz Turbo | |
| RAM | 64 GiB DDR3, fully balanced NUMA domains | 128 GiB DDR4, fully balanced NUMA domains |
| OS | CentOS 7.3 running kernel 3.10.0-514 | CentOS 7.3 running kernel 3.10.0-514 |
| gcc | 4.8.5 | 4.8.5 |
| CPU clk | 2.00GHz, acpi_cpufreq userspace | 2.00GHz, acpi_cpufreq userspace |
The clock frequency was set to 2.00GHz via userspace governor with acpi_cpufreq
driver. Disregarding for a moment the output of the benchmark, which is not
relevant, the runtime on the two platforms was the following:
[root@ivybridge ~]# time numactl --physcpubind=0 --membind=0 python lhcb.py
8.62366333218
real    0m58.239s
        user    0 m58.007s
sys 0m0.225s

[root@haswell ~]# time numactl --physcpubind=0 --membind=0 python lhcb.py
12.8205128205
real    0m39.315s
user    0m38.977s
sys 0m0.319s
The runtime highlights a speedup close to 50%.
Instruction set
To make sure the Python interpreter was making use of the same instruction set on both architectures, I
traced the benchmarks with Intel Software Development emulator. SDE is a dynamic
binary instrumentation tool capable of tracing the execution down to the assembly
instruction level, providing emulation support on Intel platforms for instructions
sets that are not natively supported by the hardware (e.g. it is possible to test
AVX512 code on a machine which provides only AVX2). Intel SDE is based on Pin
library, which uses ptrace system call on Linux to inject instrumentation
code into the application. Each instruction of the application is replaced with
a jmp to the instrumentation, allowing to gain control over every single
instruction executed. Clearly, this has a bearing on the runtime.
The first result obtained with SDE was a profile of the functions executed by the benchmarks. Ivy Bridge functions-breakdown, limited to the first 10 contributors, was the following:
#rank total-icount % cumulative% #times-called address function-name image-name
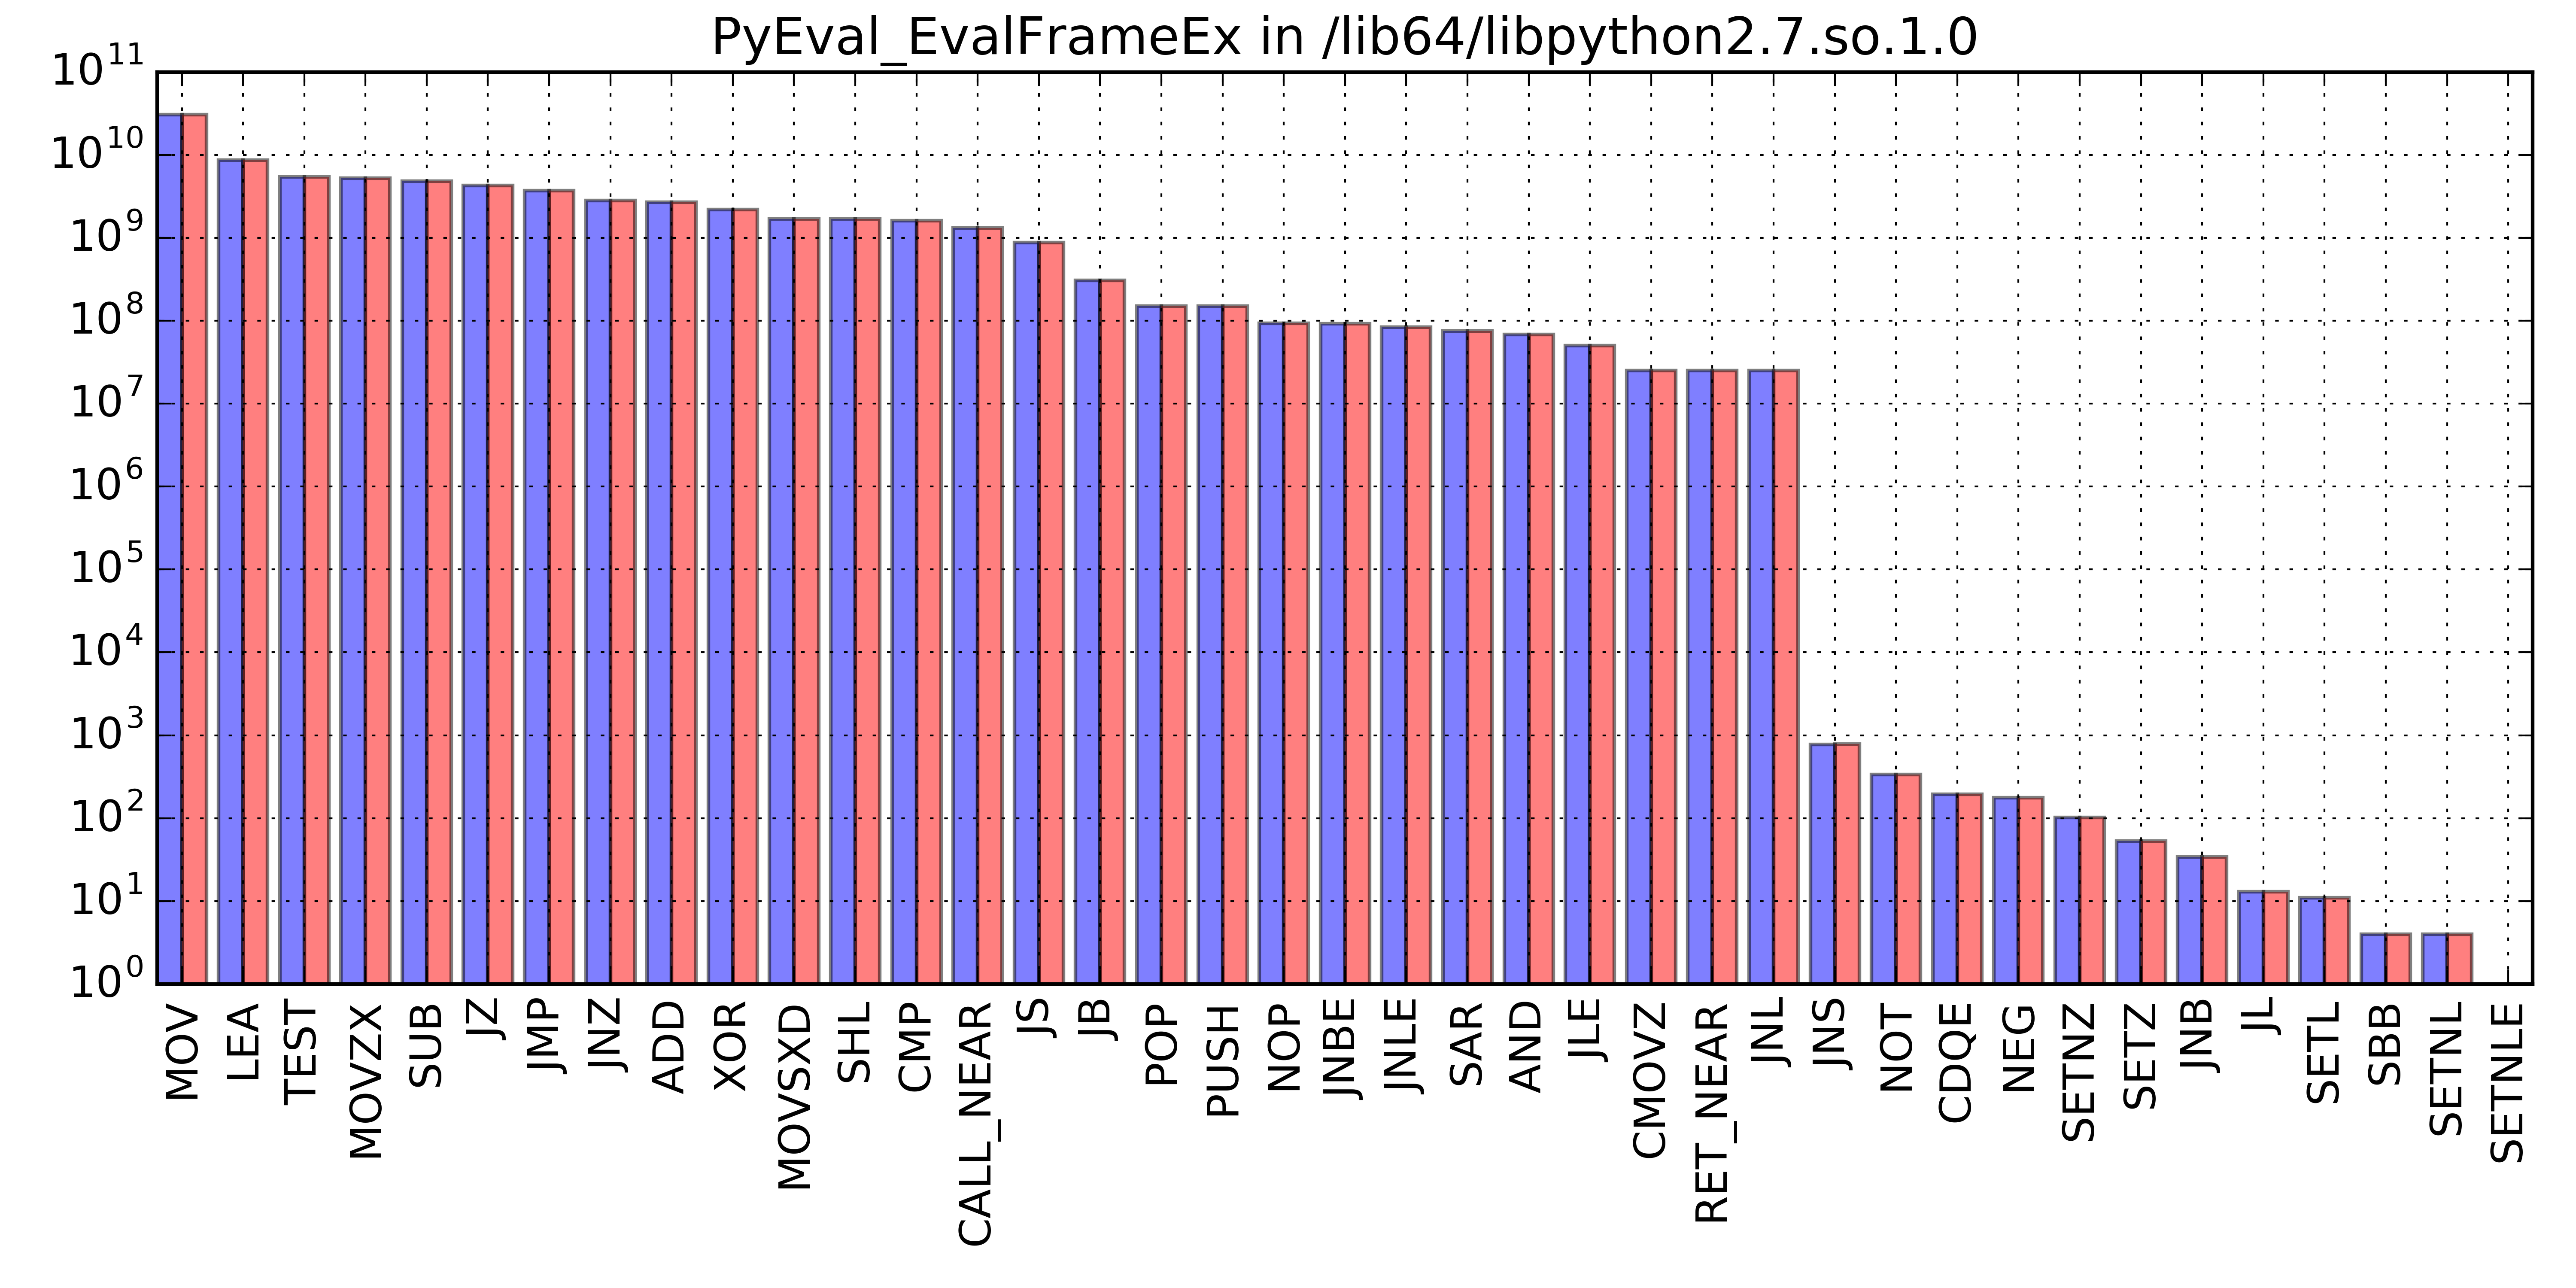
0: 78447041164 40.065 40.065 25000610 7fafdb921d00 PyEval_EvalFrameEx IMG: /lib64/libpython2.7.so.1.0
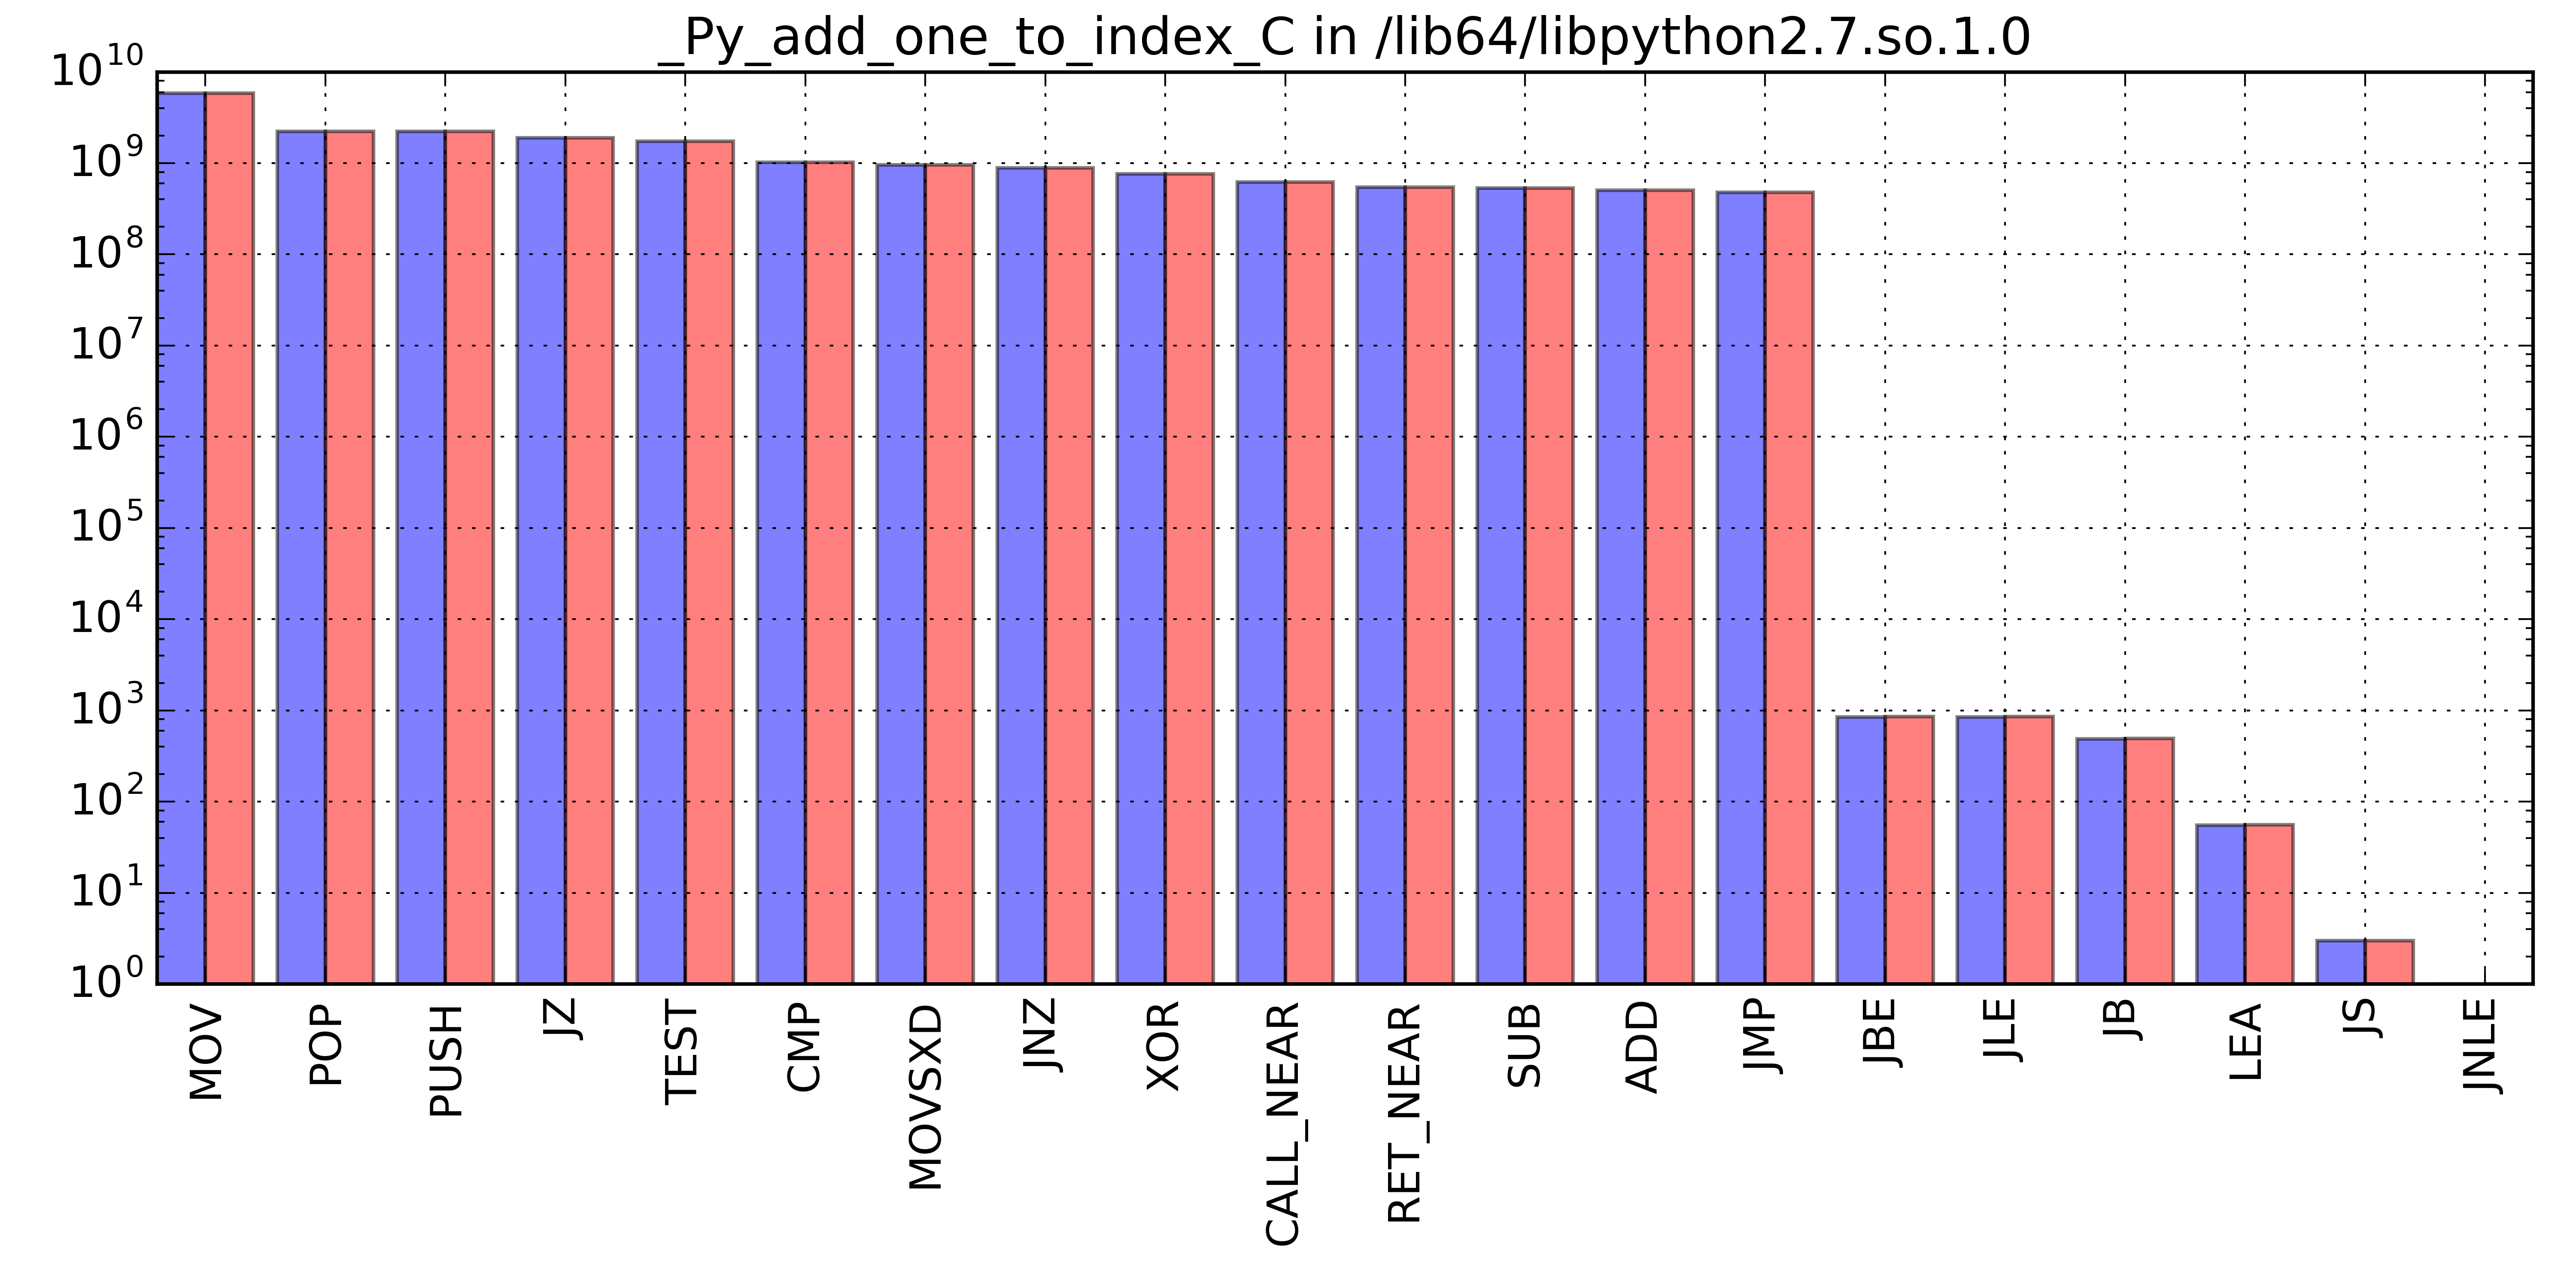
1: 20255778100 10.345 50.410 0 7fafdb88b700 _Py_add_one_to_index_C IMG: /lib64/libpython2.7.so.1.0
2: 12676220173 6.474 56.884 1 7fafdb8b07b0 PyFloat_GetInfo IMG: /lib64/libpython2.7.so.1.0
3: 7329255341 3.743 60.627 1 7fafdb8c39f0 _PyLong_Init IMG: /lib64/libpython2.7.so.1.0
4: 7048205162 3.600 64.227 542169587 7fafdb8b06f0 PyFloat_FromDouble IMG: /lib64/libpython2.7.so.1.0
5: 6911426092 3.530 67.756 1 7fafcc46e310 .text IMG: /usr/lib64/python2.7/lib-dynload/_randommodule.so
6: 6048087389 3.089 70.845 2 7fafdb8adc00 Py_UniversalNewlineFread IMG: /lib64/libpython2.7.so.1.0
7: 5218234381 2.665 73.510 34216947 7fafdaea0450 __ieee754_log_avx IMG: /lib64/libm.so.6
8: 5001235968 2.554 76.065 125029399 7fafdb8c6280 PyDict_GetItem IMG: /lib64/libpython2.7.so.1.0
9: 4450066224 2.273 78.337 76 7fafdb8b2bb0 _PyFloat_Unpack8 IMG: /lib64/libpython2.7.so.1.0Haswell functions-breakdown, also limited to the first 10 contributors, was the following:
#rank total-icount    % cumulative%   #times-called    address  function-name    image-name
0:  78443984168  40.061  40.061      25000613      7f547808ed00 PyEval_EvalFrameEx  IMG: /lib64/libpython2.7.so.1.0
1:  20255041770  10.344  50.406             0      7f5477ff8700 _Py_add_one_to_index_C  IMG: /lib64/libpython2.7.so.1.0
2:  12675720283   6.474  56.879             1      7f547801d7b0 PyFloat_GetInfo  IMG: /lib64/libpython2.7.so.1.0
3:   7329059493   3.743  60.622             1      7f54780309f0 _PyLong_Init     IMG: /lib64/libpython2.7.so.1.0
4:   7047863171   3.599  64.222     542143280      7f547801d6f0 PyFloat_FromDouble  IMG: /lib64/libpython2.7.so.1.0
5:   6910893488   3.529  67.751             1      7f546902d310 .text            IMG: /usr/lib64/python2.7/lib-dynload/_randommodule.so
6:   6047790337   3.089  70.840             2      7f547801ac00 Py_UniversalNewlineFread  IMG: /lib64/libpython2.7.so.1.0
7:   5217908380   2.665  73.504      34214316      7f5477611450 __ieee754_log_avx  IMG: /lib64/libm.so.6
8:   5001228296   2.554  76.059     125029216      7f5478033280 PyDict_GetItem   IMG: /lib64/libpython2.7.so.1.0
9:   4450065996   2.273  78.331            76      7f547801fbb0 _PyFloat_Unpack8  IMG: /lib64/libpython2.7.so.1.0
What immediately stood out from the traces above was the following:
- The two executions were pretty much identical
- The major contributor in terms of instructions executed was the Python interpreter, CPython, with
PyEval_EvalFrameEx, the core function that executes Python bytecode -
_randommodule.socontributed only for 3.5% of the total instructions, while all other contributions were mostly coming from CPython.
Results from relative comparison of instructions executed do not necessarily translate into
the same execution time comparison. It is reasonable to expect though that PyEval_EvalFrameEx is
also the major contributor in terms of time. For each function sampled by SDE, I created a histogram
associating to each instruction, the number of occurrences. Two notes, before looking into the plots:
- I have restored the histograms from a previous backup and I haven’t preserved raw data. Unfortunately, these were also unlabeled, so I could not assign a posteriori the correct architecture to the red and blue lines. Nevertheless, what they suggest is that the instruction set used on Ivy Bridge and Haswell is exactly the same, so I did not go any further in rebuilding the dataset from scratch.
- I could not restore the plot for
_randommodule.so, so it is missing from the list
Expand Py_add_one_to_index_C histogram
Expand PyFloat_GetInfo histogram

Expand PyLong_Init histogram

Expand PyFloat_FromDouble histogram

Expand Py_UniversalNewlineFread histogram

Expand ieee754_log_avx histogram

Expand PyDict_GetItem histogram

Expand PyFloat_Unpack8 histogram

Given these results, I considered worthwhile having a closer look at
the main contributor, PyEval_EvalFrameEx.
Analyzing PyEval_EvalFrameEx
PyEval_EvalFrameEx is the heart of the CPython interpreter, where
bytecode is decoded and executed. Its implementation resides in
Python/ceval.c and makes use of a huge switch statement (1500 LOC)
that dispatches the current opcode to the corresponding case branch
for execution. In CPython 2.7.5, it looks like the following:
switch (opcode) {
    case NOP:
        <NOP Instruction>
        break;
    case LOAD_FAST:
        <LOAD_FAST Instruction>
        break;
    case LOAD_CONST:
        <LOAD_CONST Instruction>
        break;
    case STORE_FAST:
        <STORE_FAST Instruction>
        break;
    case POP_TOP:
        <POP_TOP Instruction>
        break;
    case ROT_TWO:
        <ROT_TWO Instruction>
        break;
    [...]
    case UNARY_CONVERT:
        <UNARY_CONVERT Instruction>
        break;
    [...]
}
Switch constructs are normally implemented in assembly with jump
tables, assigning a label to each branch which constitutes the
target of a jumps instruction when a matching argument in the switch
statement is encountered. The jump is indirect: the destination
address is loaded in a register or taken directly from memory. This
is somehow coherent with the profile of PyEval_EvalFrameEx, where
jmp is the seventh most recurrent instruction. Now, in a
further attempt to reproduce a workload that yields a 50% speedup on
Haswell architecture, I tried to write some basic code that would
replicate this indirect jmp intensive workload.
The code can be found at instr-miss-benchmark repository. The script implements a large switch statement dispatching in loop either a sequential opcode sequence or a random one. The results are as follows (the number of case branches is 512):
Ivy Bridge, sequential opcode, lenght of the sequence is 512
# perf stat numactl --physcpubind=0 --membind=0 ./branch -l 512

 Performance counter stats for 'numactl --physcpubind=0 --membind=0 ./branch -l 512':

       9523.964000      task-clock (msec)         #    0.945 CPUs utilized
                 7      context-switches          #    0.001 K/sec
                 1      cpu-migrations            #    0.000 K/sec
               325      page-faults               #    0.034 K/sec
    20,113,446,420      cycles                    #    2.112 GHz
     9,133,199,611      stalled-cycles-frontend   #   45.41% frontend cycles idle
     6,205,524,997      instructions              #    0.31  insn per cycle
                                                  #    1.47  stalled cycles per insn
     1,347,544,552      branches                  #  141.490 M/sec
       260,595,846      branch-misses             #   19.34% of all branches

      10.082002557 seconds time elapsed
Ivy Bridge, random opcode, lenght of the sequence is 512
# perf stat numactl --physcpubind=0 --membind=0 ./branch -r -l 512

 Performance counter stats for 'numactl --physcpubind=0 --membind=0 ./branch -r -l 512':

       8827.884037      task-clock (msec)         #    0.912 CPUs utilized
                 6      context-switches          #    0.001 K/sec
                 0      cpu-migrations            #    0.000 K/sec
               325      page-faults               #    0.037 K/sec
    19,306,672,146      cycles                    #    2.187 GHz
     8,494,665,929      stalled-cycles-frontend   #   44.00% frontend cycles idle
     6,204,896,270      instructions              #    0.32  insn per cycle
                                                  #    1.37  stalled cycles per insn
     1,347,354,632      branches                  #  152.625 M/sec
       257,970,218      branch-misses             #   19.15% of all branches

       9.677276472 seconds time elapsed
Haswell, sequential opcode, lenght of the sequence is 512
# perf stat numactl --physcpubind=0 --membind=0 ./branch  -l 512

 Performance counter stats for 'numactl --physcpubind=0 --membind=0 ./branch -l 512':

       4911.183097      task-clock (msec)         #    0.983 CPUs utilized
                44      context-switches          #    0.009 K/sec
                 2      cpu-migrations            #    0.000 K/sec
               322      page-faults               #    0.066 K/sec
     9,961,459,259      cycles                    #    2.028 GHz
     6,190,421,781      instructions              #    0.62  insn per cycle
     1,344,838,747      branches                  #  273.832 M/sec
        91,048,715      branch-misses             #    6.77% of all branches

       4.995183920 seconds time elapsed
Haswell, random opcode, lenght of the sequence is 512
# perf stat numactl --physcpubind=0 --membind=0 ./branch  -r -l 512

 Performance counter stats for 'numactl --physcpubind=0 --membind=0 ./branch -r -l 512':

       2885.842547      task-clock (msec)         #    0.998 CPUs utilized
                24      context-switches          #    0.008 K/sec
                 2      cpu-migrations            #    0.001 K/sec
               322      page-faults               #    0.112 K/sec
     5,764,806,412      cycles                    #    1.998 GHz
     6,184,385,850      instructions              #    1.07  insn per cycle
     1,343,650,997      branches                  #  465.601 M/sec
        23,396,176      branch-misses             #    1.74% of all branches

       2.890916053 seconds time elapsed
The comparison highlights that with a negligible delta
in the number of branches executed by the CPU, the number of branch
mispredictions is instead much higher on Ivy Bridge. A mispredicted branch is a
wrong guess taken by the front-end of the pipeline when deciding where to fetch the
next instruction. This prediction is made when fetching an instruction block: the
front-end tries to guess if the block will branch and, in this case, where it will land.
In fact, guessing the destination address is referred to as Branch Target Prediction,
as we have branching instruction (e.g. jump) which uses an indirect operand of the type:
jmp *raxThe prediction is done very early to avoid having to wait for the decode and execution stages of the pipeline. The obvious consequence is that the guess might be wrong. In that case, the instructions that have been fetched following a wrong prediction are flushed from the pipeline and the execution resumes from the correct control path.
When using a random opcode sequence of lenght 512, the number of mispredicted branches is 10 times higher on Ivy Bridge, with a difference in number of branches of only 0.2%. There is another interesting result that stands out: on Haswell, a sequential opcode sequence generates a higher number of mispredictions compared to a random one.